Enrollment by Zip Code, Level and Department
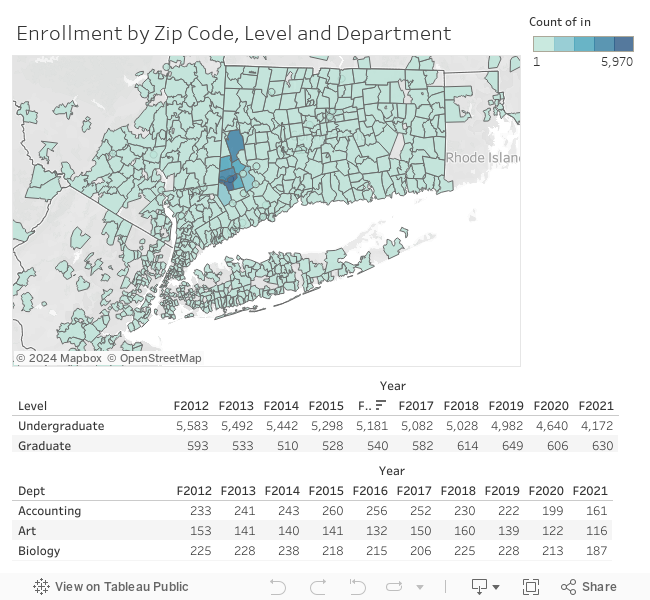
This visualization is based on 10 fall semesters of enrollment data. It shows the number of students from each home ZIP code and state by year, department, and level (graduate/undergraduate).
This visualization is based on 10 fall semesters of enrollment data. It shows the number of students from each home ZIP code and state by year, department, and level (graduate/undergraduate).